Service sector jobs in the United States are characterized by low pay, few fringe benefits, and limited employee control over scheduled work days and times.1 Many service sector employers across the country rely on just-in-time and on-call scheduling practices designed to minimize labor costs by closely aligning staffing with consumer demand.2 These practices can introduce significant instability into the lives of workers and their families.3
This research brief is part of a series designed to advance our understanding of working conditions in the service sector–in particular, schedule instability and unpredictability–in cities and states across the country. Since 2016, The Shift Project has collected survey data from workers employed at large chain retailers and food service establishments.4 We ask respondents about their work schedules, household economic security, health, and wellbeing, targeting employees at large firms that are the focus of recent state and local labor regulation efforts. Our data permit an unprecedented view of scheduling conditions in the service sector and provide new insight into the work and family lives of low-wage workers.
Over 200,000 people are employed in the retail and food service sectors in the Boston metropolitan area.5 In this brief, we explore data from 1,163 workers in order to highlight the experiences and working conditions reported by service sector workers in the Boston area.
Wages and Work Hours
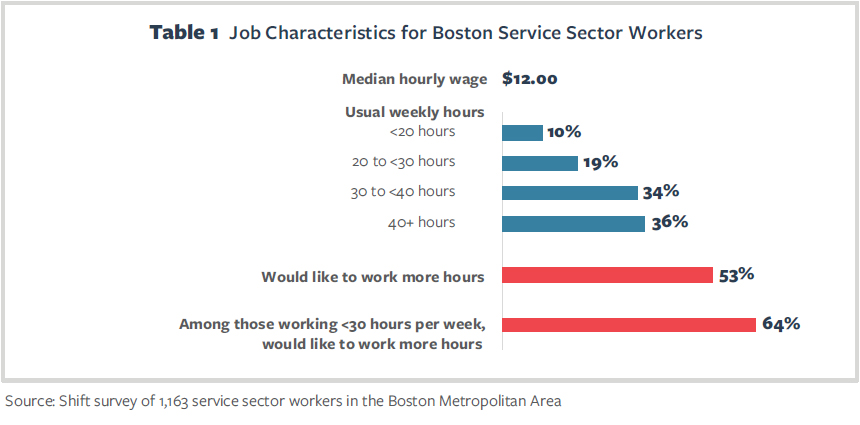
In Boston, as elsewhere in the United States, the service sector is dominated by low-wage jobs. During our observation period, from 2016 to 2017, the Massachusetts minimum wage was $10.00 per hour (2016) and later increased to $11.00 (2017).6 Workers in our Boston sample reported a median hourly wage of $12.00, slightly higher than the minimum. This median wage, while substantially higher than the $7.25 federal minimum wage, still falls well below the estimated hourly living wage of $14.11 for a single individual with no children living in the Boston area, and falls shorter still of the wages needed to provide for a family.7
The living wage estimate provided above is based on year-round full-time employment, and yet, only a third of Boston service sector workers report working at least 40 hours per week. The rest usually work part-time: 34% report working between 30 and less than 40 hours per week, 19% usually work between 20 and less than 30 hours, and 10% work fewer than 20 hours per week.
What do workers want? Although some workers may prefer a part-time work schedule, the majority of workers we surveyed reported a desire for more work hours than they typically receive. Over half of Boston workers–53% overall, and 64% among those working fewer than 30 hours per week–reported that they would like to work more hours. A sizeable share of all workers (19%) can be characterized as “involuntary part-time” workers who work fewer than 30 hours per week and would like more hours. These reports suggest that most service sector workers, particularly those who work part-time, are getting fewer hours than they would like.
Unstable and Unpredictable Work Schedules
Boston-area workers also experience unstable and unpredictable work schedules, which may compound the challenges associated with low wages and part-time employment.
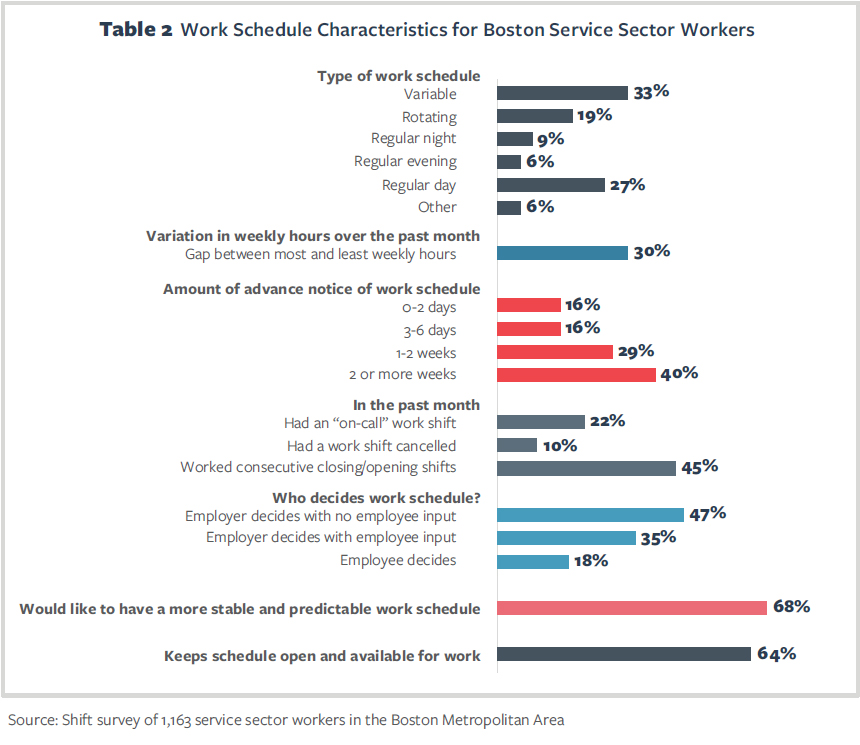
Nearly three-quarters of the workers in our sample report non-standard work schedules: 33% report “variable” schedules, 19% report “rotating” schedules, and another 15% report regularly working night or evening shifts. Only 27% of service sector workers report a regular daytime work schedule.
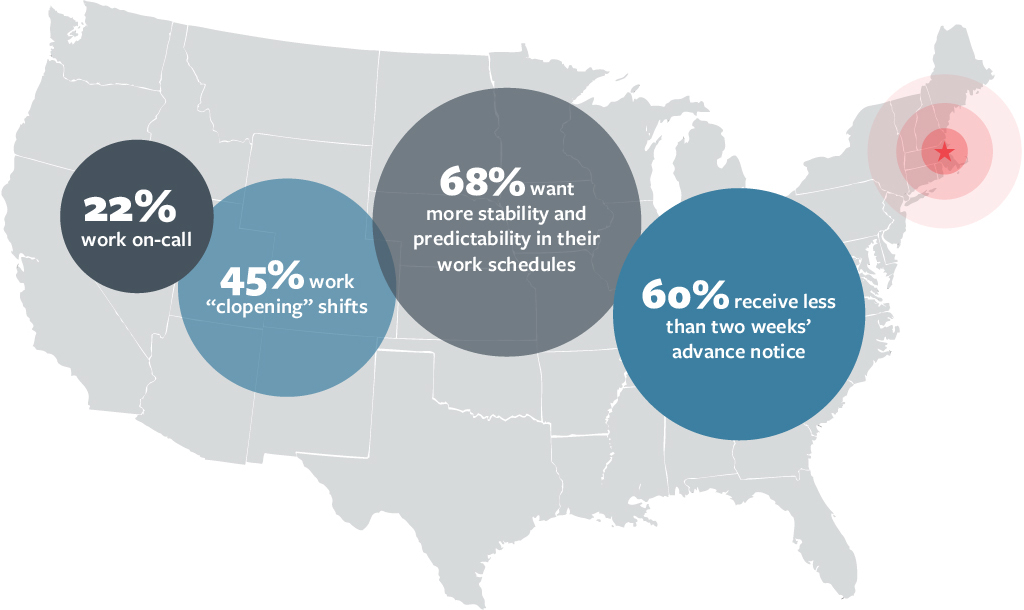
We also asked workers whether they had experienced certain workforce management practices associated with scheduling instability in the past month. Twenty-two percent of workers reported working an “on-call” work shift, meaning that they kept their schedule open and available for work but may or may not actually have been called in to work the shift. Ten percent of workers reported having a shift cancelled in the past month. Forty-five percent of workers reported working consecutive closing then opening shifts, referred to as “clopening.”
Boston workers also experience a great deal of variation in the total number of hours worked each week. When asked about their work schedule over the past month, the average worker reported a difference of 12 hours between the week they worked the most hours and the week they worked the fewest hours (a 33% gap between most and fewest weekly hours worked). Given our focus on workers who are paid hourly, we can infer that these variations in hours lead to volatility in earnings.
In addition to the common experience of schedule instability, many workers receive limited advance notice of their work schedules. Only 40% of workers receive more than 2 weeks’ advance notice of their work schedules. Twenty-nine percent receive between 1 and 2 weeks’ notice. The remaining 31% of workers receive less than 1 week’s advance notice, and of those, half receive no more than 2 days’ notice.
We also find that these workers often do not have control over their schedules: nearly half of workers have no input when it comes to setting their work schedules, 35% have some input, and only 18% of workers have a large degree of control over their scheduled work days and times. In fact, most workers (64%) reported that even in their personal time, they have to keep their schedule open and available for work. These measures show that many Boston service sector workers experience unstable and unpredictable work schedules, which may affect workers’ ability to balance work and family responsibilities, to combine work with schooling or other pursuits, and to achieve a work-life balance.
What do workers want? Although some workers may have the flexibility to accommodate unstable and unpredictable work schedules, a large majority of workers are unhappy with the status quo. When asked their preference, 68% of workers said that they “would like to have a more stable and predictable work schedule.” This share was even higher among Boston workers who reported a variable schedule or on-call shifts in the prior month: 4 out of 5 of these workers said they would prefer a more stable and predictable schedule.
Challenges Reported by Workers in the Boston Area
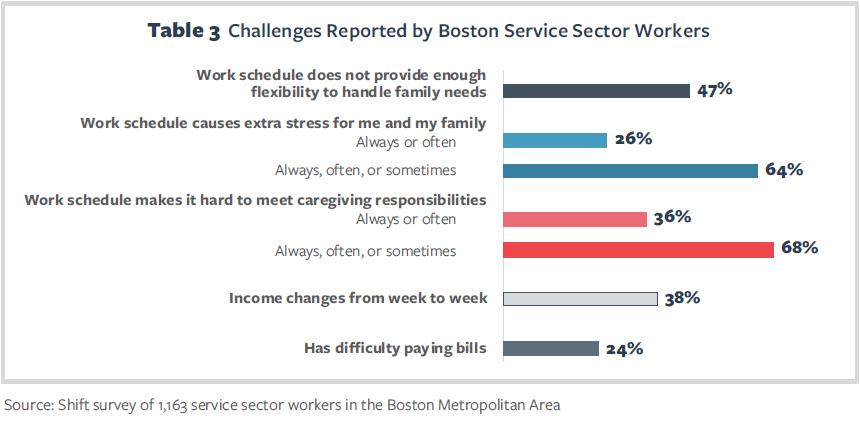
Given the constellation of unstable and unpredictable scheduling practices experienced by Boston-area service sector workers in our sample, it is not surprising that many of these workers report that their work schedule interferes with their family needs and caregiving responsibilities. Half of workers express that their work schedule does not provide enough flexibility for them to handle family needs. Two-thirds of workers say that their work schedule causes some amount of extra stress for their family, and 26% report that their schedule is a chronic source of extra stress. Thirty-six percent say that their work schedule always or often makes it hard to meet their caregiving responsibilities, while 68% sometimes, often, or always experience conflicts between work and their caregiving responsibilities.
Another consequence of unstable work hours is unstable earnings and accompanying financial challenges. Thirty-eight percent of workers report that their income changes from week to week, and a quarter report that they have difficulty paying their bills.
The Relationship Between Work Schedules and Worker Health and Hardship
Exposure to unstable and unpredictable schedules may also negatively affect workers’ health and wellbeing. For example, short notice and last-minute schedule changes may lead to economic instability for workers and may also increase work-life conflict, while lack of certainty about one’s schedule may be an added source of stress.
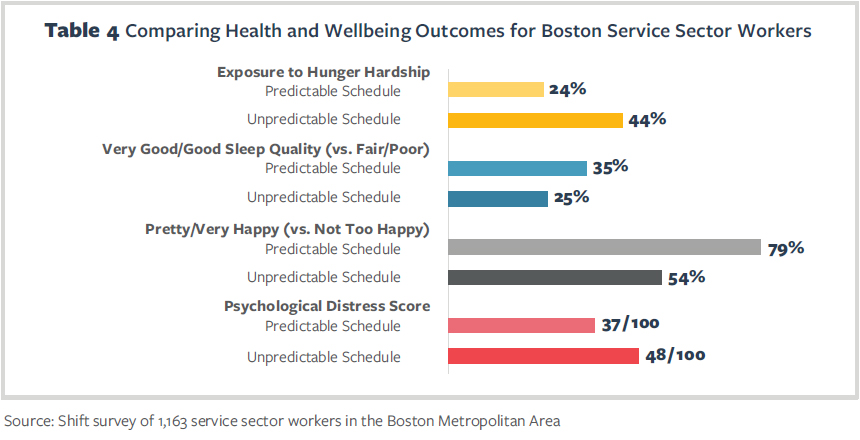
In this section, we examine how the work schedules of Boston workers are related to health and hardship, and use our observations to make comparisons between workers exposed to different scheduling practices. We contrast two groups of workers: those with predictable schedules and those with unpredictable schedules. We define workers with predictable schedules as those who had at least 2 weeks’ advance notice of their schedules, did not work on-call in the last month, and did not have a cancelled shift in the last month. We define workers with unpredictable schedules as those who received less advance notice, worked on-call, and experienced at least one cancelled shift. Comparing these two groups of workers, we find that:
- Workers with unpredictable work schedules are much more likely to report having experienced hunger hardship in the past year. Our survey asked all workers, “In the past 12 months, were you ever hungry, but didn’t eat because you couldn’t afford enough food?” Twenty-four percent of Boston workers with predictable schedules experienced hunger in the past year, compared to 44% of workers with unpredictable schedules.
- Workers with unpredictable work schedules report worse sleep quality. Thirty-five percent of Boston workers with predictable schedules report good or very good sleep quality, compared to only a quarter of workers with unpredictable work schedules.
- Workers with unpredictable work schedules are less happy. Four out of five Boston workers with predictable schedules report being happy overall, compared to just over half of workers with unpredictable work schedules.
- Workers with unpredictable work schedules are significantly more distressed. We asked workers how often they felt each of six types of distress in the past month (sadness, nervousness, restlessness, hopelessness, that everything was an effort, and that difficulties were piling up high). The average Boston worker with a predictable work schedule reported each type of distress “a little of the time,” while workers with unpredictable schedules experienced more prevalent distress, on average reporting each type of distress “some of the time.” Overall, workers with unpredictable schedules scored 31% higher on the distress scale than those with predictable schedules.8
Discussion
The Shift Project’s Boston report mirrors broader trends in our national survey data: across the country, retail and food service jobs are characterized by low pay, underemployment, and a lack of control over scheduled work hours. Scheduling practices may begin to change, however, as some localities have passed laws that regulate work schedules. The state of Oregon, New York City, Philadelphia, Seattle, San Francisco, and Emeryville (CA) have all passed legislation or implemented regulations requiring that hourly workers receive a certain amount of advance notice of work schedules (usually 2 weeks) and stipulating that workers be compensated by employers when their shifts are changed on shorter notice.
In Massachusetts, as well, recent legislation introduced policies that may impact workers in our sample. HB 4640, which was signed in 2018, will roll back a provision entitling workers to overtime pay for hours worked on Sundays and some holidays. At the same time, the bill raises the hourly minimum wage to $15.00 by 2023, potentially impacting the 82% of workers in our sample who currently earn less than $15.00 per hour. The bill also introduced a family medical leave program, effective in 2021, which will allow workers up to 12 weeks of paid leave.9
While these policies promise higher wages and family leave for Boston workers, our data draw attention to another important dimension of low-wage work: chronically unstable and unpredictable work schedules. We find that schedule insecurity is a normal feature of service sector jobs in the Boston area. Many workers experience short advance notice and last-minute scheduling changes, variation in the number of hours worked from week to week, and resultant volatility in earnings. We also document strong relationships between these unstable schedules and undesirable outcomes such as hunger and poor sleep quality.
Were Boston to follow the lead of cities like New York, Seattle, and Philadelphia and pass secure scheduling laws, our data suggest that such legislation could have a significant impact on service sector workers and their families, and would be responsive to workers’ prevailing desire for more hours and more stable work schedules.
Endnotes
-
- Lambert, S. J. 2008. “Passing the Buck: Labor Flexibility Practices that Transfer Risk onto Hourly Workers.”
Human Relations
-
- 61(9): 1203-1227.
2 Golden, L. 2015. “Irregular Work Scheduling and Its Consequences.” Briefing Paper #394. Economic Policy Institute; Appelbaum, E., A. Bernhardt, and R. J. Murnane. (Eds.). 2003. Low-Wage America: How Employers are Reshaping Opportunity in the Workplace. New York: Russell Sage Foundation; Clawson, D., and N. Gerstel. 2015. Unequal Time: Gender, Class, and Family in Employment Schedules. New York: Russell Sage Foundation.
3 Lambert, S.J., P. Fugiel, and J. R. Henly. 2014. Precarious Work Schedules among Early-Career Employees in the US: A National Snapshot. University of Chicago; Schneider, D. and K. Harknett. 2019. “Consequences of Routine Work Schedule Instability for Worker Health and Wellbeing.” American Sociological Review.
4 Further details about our data collection and methodology are presented in an Appendix at the end of this brief.
5 In this research brief, we limit our sample to respondents who reported working in Core-Based Statistical Area (CBSA) 71654, which includes data from the Boston-Cambridge-Newton, MA New England City and Town Area (NECTA); https://www.bls.gov/oes/current/oes_71654.htm.
6 Massachusetts’ $11.00 hourly minimum wage remained in effect until December 2018. On January 1, 2019, the rate increased to $12.00, the first in a series of scheduled increases that will raise the wage to $15.00 by 2023. The data presented in this brief were collected between 2016 and 2018, and do not reflect wage increases occurring after 2018.
7 The Living Wage Calculator, created by Dr. Amy K. Glasmeier, Professor of Economic Geography and Regional Planning at MIT.
8 These findings are based on “regression analysis,” a widely-used analytic technique in the social sciences, which is designed to isolate the effects of unpredictable work schedules while “holding constant” other influences. In this case, the reported relationships between having an unpredictable work schedule and health and hardship outcomes are “net of” statistical controls for worker age, gender, children in household, educational attainment, school enrollment, marital status, household income, hourly wage, job tenure, usual hours, and managerial status, as well as year and month fixed-effects. However, we also note that these are not causal estimates. These results are based on the same regression models that we use to estimate the association between work schedules and worker health and wellbeing for a national survey of workers. These methods are described in detail in Schneider, D. and K. Harknett. 2019. “Consequences of Routine Work Schedule Instability for Worker Health and Wellbeing.” American Sociological Review.
9 Commonwealth of Massachusetts HB 4640: An Act Relative to Minimum Wage, Paid Family Medical Leave, and the Sales Tax Holiday; https://malegislature.gov/Bills/190/H4640.